For this tutorial we will be using CloudCompare (version 2.8,
cloudcompare.org)
Lidar point clouds normally come with elevations above sea level (or some other datum), which is
extremely useful. However, we can convert the Z-values into a height above the ground as way to add another layer of data so that we can measure things like average tree heights, examine building heights., or (one thing I do a lot) filter the points to so that we only see points in a specific height range above the ground. This last application is what we'll be covered here and it's really useful to examine river channels below dense vegetation.
- In CloudCompare, load your LAS file. Except the defaults for the popup's that come.
- If your point cloud has a lot of extraneous data (outside your area of interest), now is a good time to use the "Cross Section" or "Segment" tools to trim down the points to just the area you need. I usually leave a little around the edges.


For your segmented point cloud, we'll do a couple of steps to establish the ground surface.
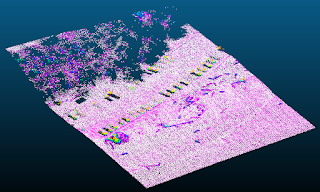
- Switch the "Active Scalar Field" in the Properties sidebar to Classification
- Using the "Filter Points By Value" tool, we'll extract the points with a classification values of 2 (the default ground classification)

- The Range is 2.0 - 2.0
- Use the Export option to create a new point cloud
- Next we will create a mesh surface from the ground points.
- Select the ground points in the DB Tree sidebar
- In the "Edit" menu, select Mesh > Delaunay 2.5D (XY Plane)
- Max edge length can be left at 0
- Click OK to create the mesh
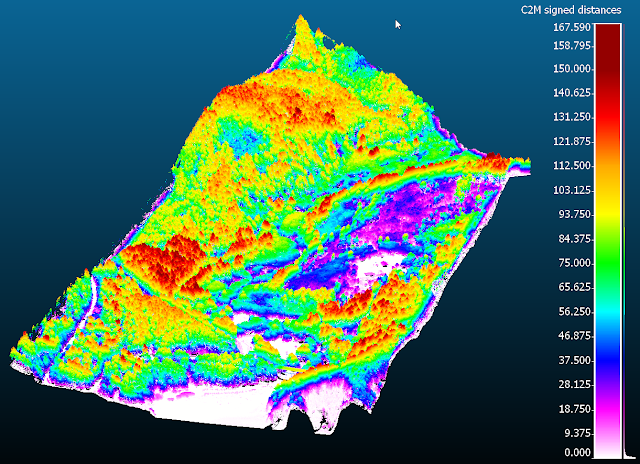
- Next we'll calculate the distance from the ground mesh to the points, which gives us height above the ground.
- In the DB Tree select both the ground mesh and the segmented point cloud (using Control-Click on Windows to select multiple items)
- Activate the "Calculate Cloud/Mesh Distance" tool in the toolbar

- Leave the defaults and click "Compute" (This will take a little time...)
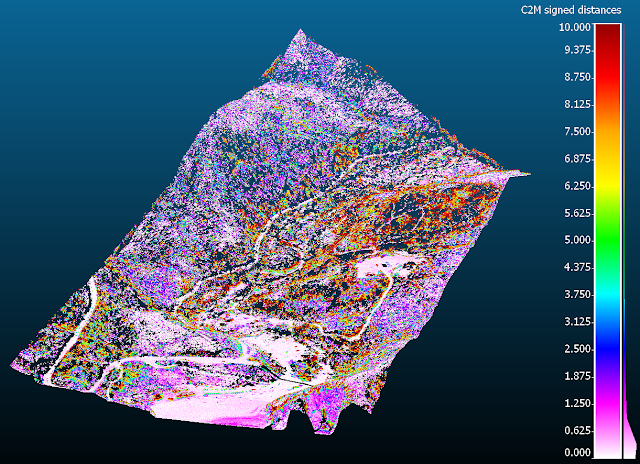
- Now we have a new attribute on our segmented point cloud, available in the "Active Scalar Field" dropdown in the Properties sidebar - "C2M signed distances"
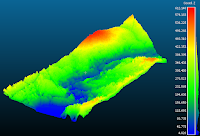 |
| Colored by Elevation (Above Sea Level) |
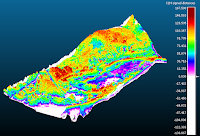 |
| Colored by Height Above Ground |
- In the property sidebar, you can adjust the color ramp, and usually you'll need to adjust the bottom saturation value to zero.
- There are two ways to filter the data at this point: "Filter Points By Value" or using temporary adjustments.
- Temporary adjustments can be made in the "SF Display Params" section of the Properties sidebar.
- First thing to do is click on the Parameters tab and uncheck the "show NaN..." option. This will make points outside the range disappear.
- Back on the "Display Ranges" tab, you can adjust the displayed range using the circle markers on the graph display. You can also enter specific values in the two text boxes at the top.
- I usually change the saturation values to match the displayed range too. This ensures that your color ramp is maximized for the displayed data.
- To extract a specific range, use the "Filter Points By Value" tool like we did above and enter the upper and lower values you wish to extract.
- As you zoom in and out to navigate, it will be necessary to define the rotation point of the point cloud (otherwise you'll go mad trying to keep things in view).
- Click on the "Pick rotation Center" tool on the toolbar (Cross hair icon)
- Click on a point in the middle of the area you want to look at.
- As you move around you can do this as many times as you need to.
- Another thing to do is increase the default point size, hover your mouse upper-left of the 3D view to increase or decrease the point size.
- One more helpful tool is the "Eye Dome Lighting" filter on the tool bar, this simulates a hillshade-like shading on the points.
 |
| All points - height above the ground |
 |
| Filtered points - 10 feet above the ground |
 Lidar point clouds normally come with elevations above sea level (or some other datum), which is


Thanks mate!
ReplyDeleteLidar is a digital technology that used to measures the distance of a target using laser light. This technology can measures the distance so accurately. Further, the cost of this technology is very affordable. Lidar Calgary, Alberta
ReplyDeleteLidar is a device used to measure the length and distance accurately. The measurement of lidar is so accurate. if you need the best lidar scanning service then you can visit our site. lidar scanner Calgary, Alberta
ReplyDeletedimeapp.in is one of the fastest Live cricket score app performing in the arena of Cricket match scores and You can choose any upcoming match of your choice to watch it over and get full insights over Match history.
ReplyDeletedimeapp.in is an Ads free cricket app which makes your cricket viewing experience even more exciting plus Accurate match odds with session updates, Search matches date-wise, team-wise, and series-wise too.
dimeapp.in is 100% free to download and use an app for viewing All T20, ODI, Domestic and International women/men Test Matches and even IPLs and PSL. You can even watch the World Cup, Asia Cup and upcoming schedules of upcoming matches in this App.
dimeapp.in is the No.1 rating app on our list. This app is a lifeline for cricket lovers. Not only, it is interactive & convenient-to-use software, but it furthermore wraps all aspects of cricket.
It will give to the detailed stats, rankings & records, Precise odd-even sessions. Even it also helps to skillfully navigate team/date/year wise matches. It also provides daily articles & alerts on feverish cricket headlines.
As per reviews and information on the Internet, we will recommend dimeapp.in for a cricket lover to satisfy their craving to know the scores fastest of fast that too with free-subscription & Ads-free...
Pro dissertation writing provides the best Academic Writing Services , we are one of the leading academic writing company in UK.
ReplyDeleteIf only there was a video it would be great
ReplyDeleteFirst, they facilitate and simplify terrain modeling and soil measurements that precede construction projects. Second, they help them to plan the best roadways regarding traffic patterns and aesthetics via topographical surveying. 3d laser scanning survey Sydney
ReplyDeleteI appreciate you sharing this useful blog with us so much. Share your valuable information at all times.
ReplyDeleteBiocomptesting, Inc.
Could somebody update these instructions using v2.13.1
ReplyDeleteI can't work it out using these instructions
A good reminder that raw LiDAR data becomes much more valuable once it’s filtered properly. The example with river channels highlights how 3d laser scanning land surveying can improve accuracy in areas where visibility is usually a challenge.
ReplyDelete